

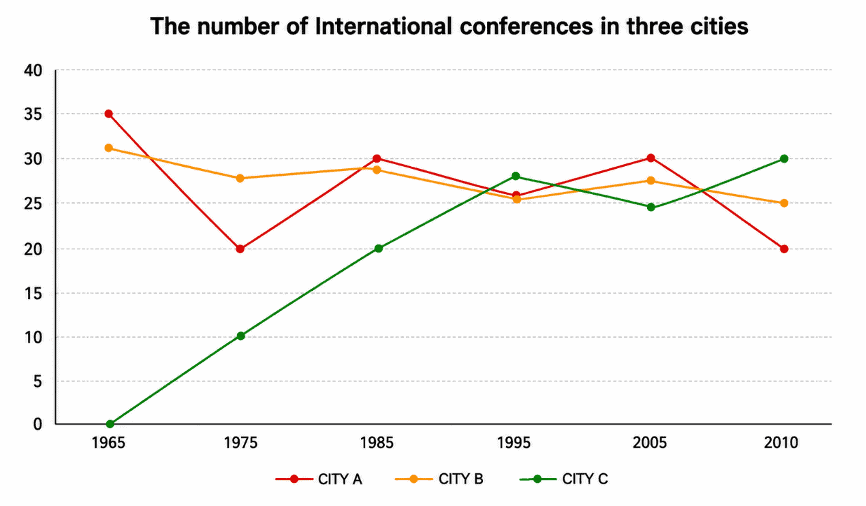
The line graph gives information about the number of international conferences in three cities from 1965 to 2010.
Video bài giảng

Mở bài
Để làm được mở bài, ta chỉ cần paraphrase lại đề (paraphrase = dùng từ đồng nghĩa để viết lại đề).
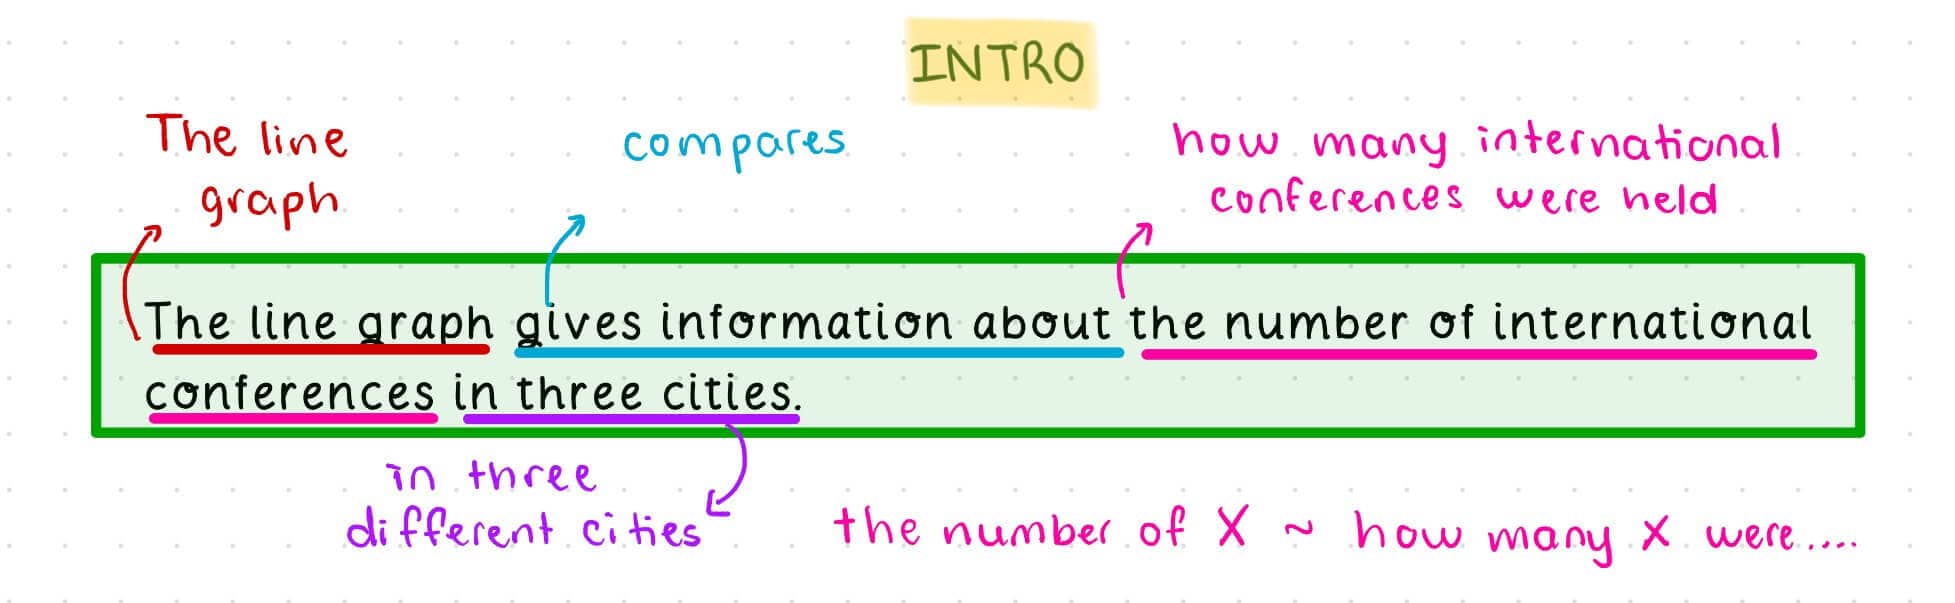
The line graph compares how many international conferences were held in three different cities between 1965 and 2010.
Tổng quan
Đối với biểu đồ thay đổi theo thời gian như bài này, để viết được tổng quan, ta sẽ tập trung vào hai phần chính:
- Xu hướng: xu hướng chung của từng đường
- Nổi bật: cao nhất, thấp nhất, khác nhất, …
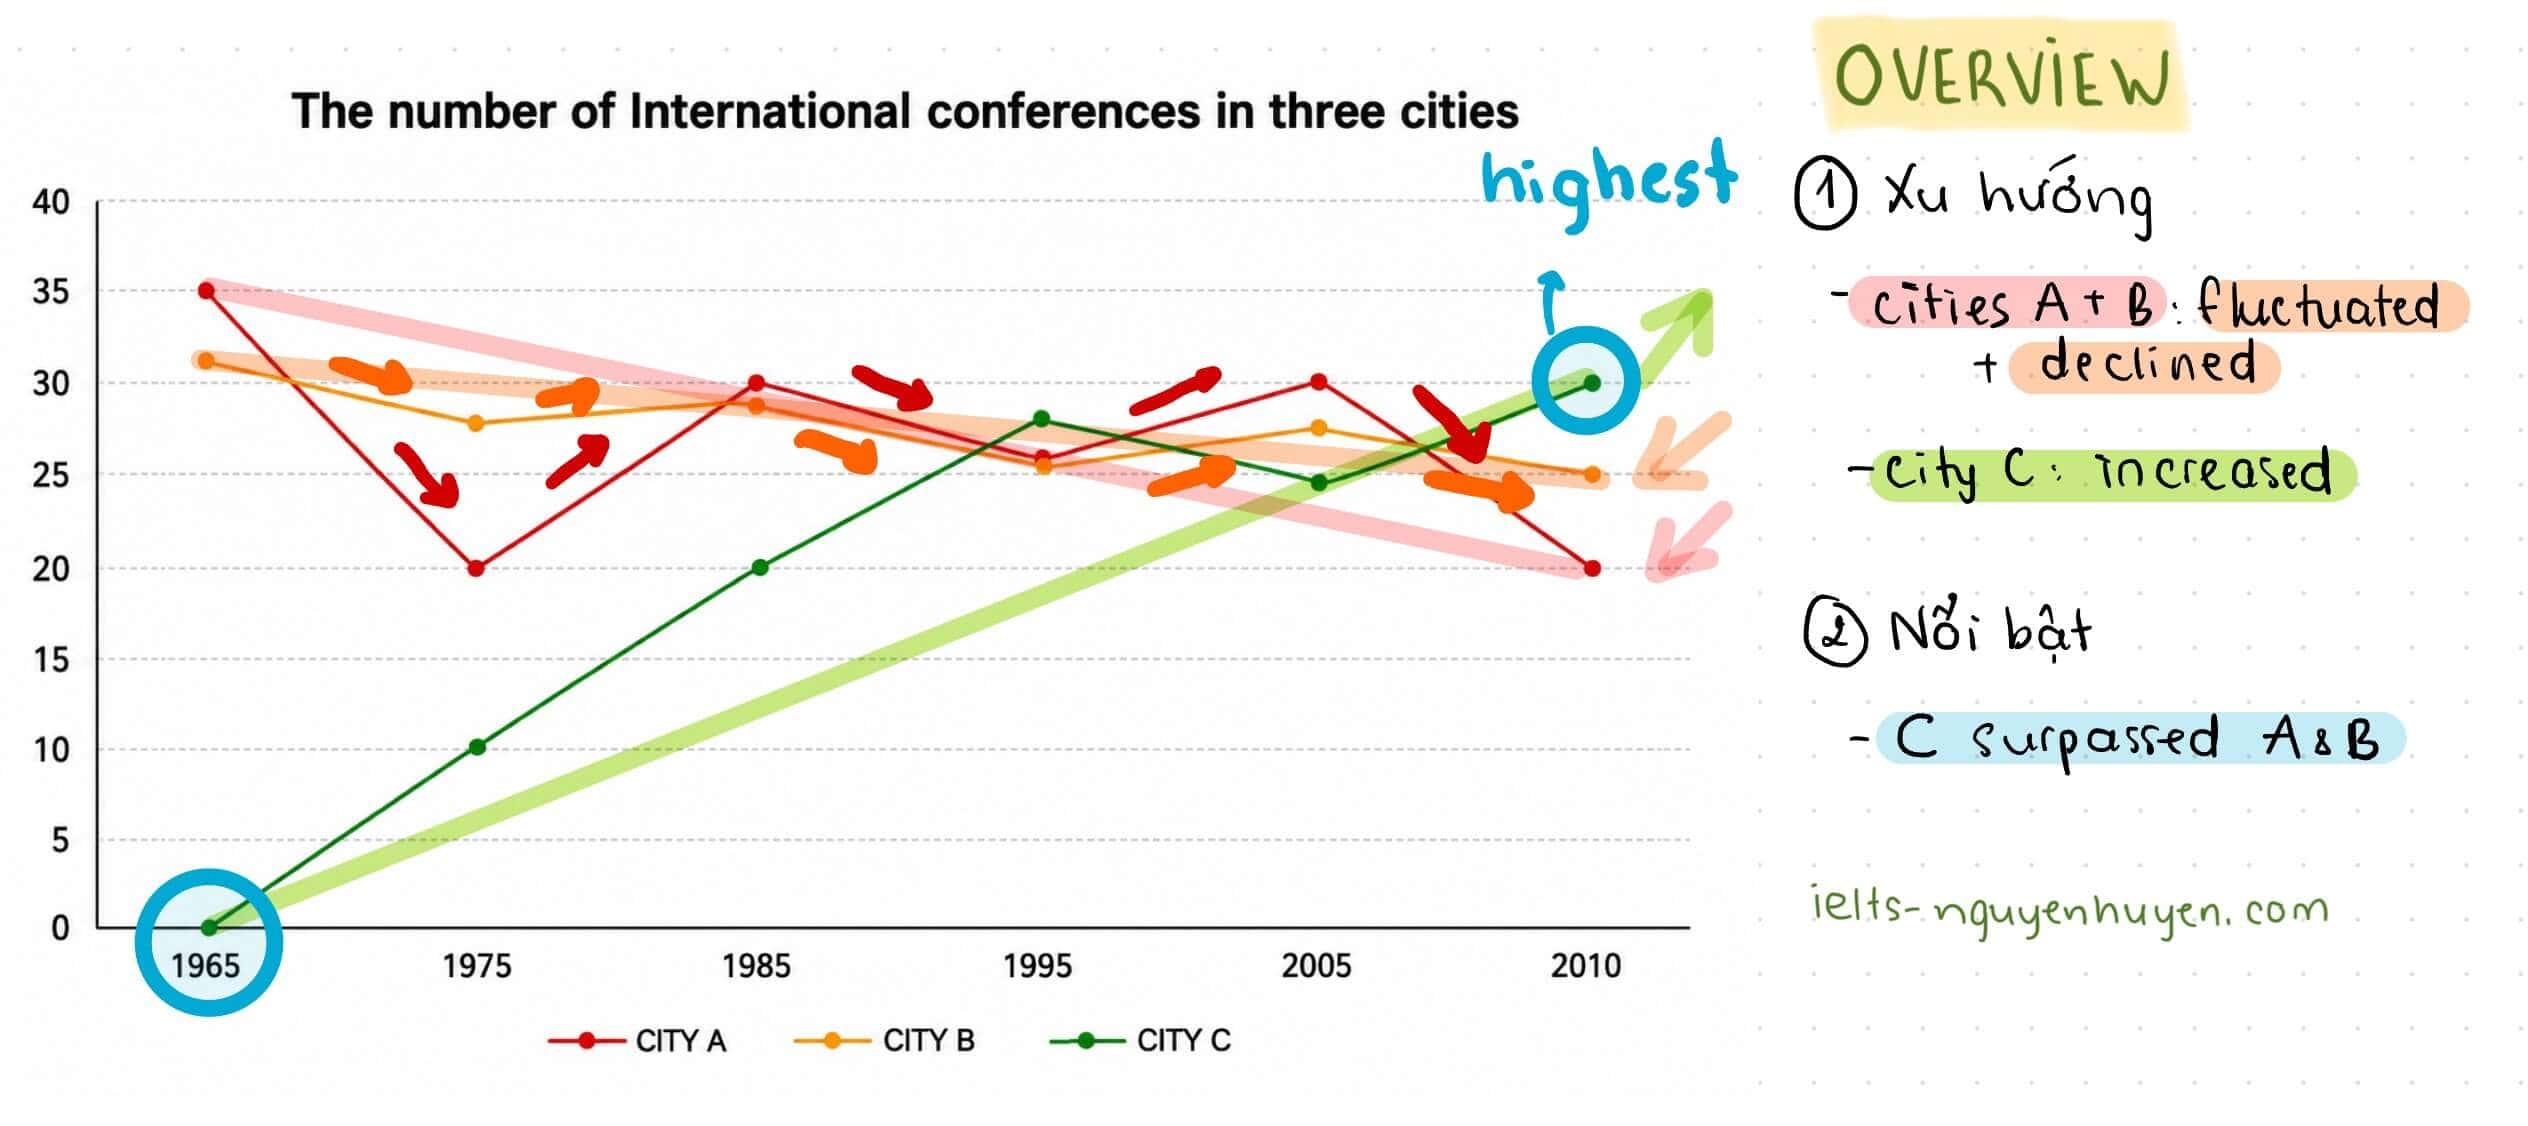
Overall, cities A and B, despite some fluctuations, experienced overall declines in the number of international conferences over the given period, while city C witnessed a substantial increase, eventually surpassing the other two cities at the end of the period.
Outline thân bài
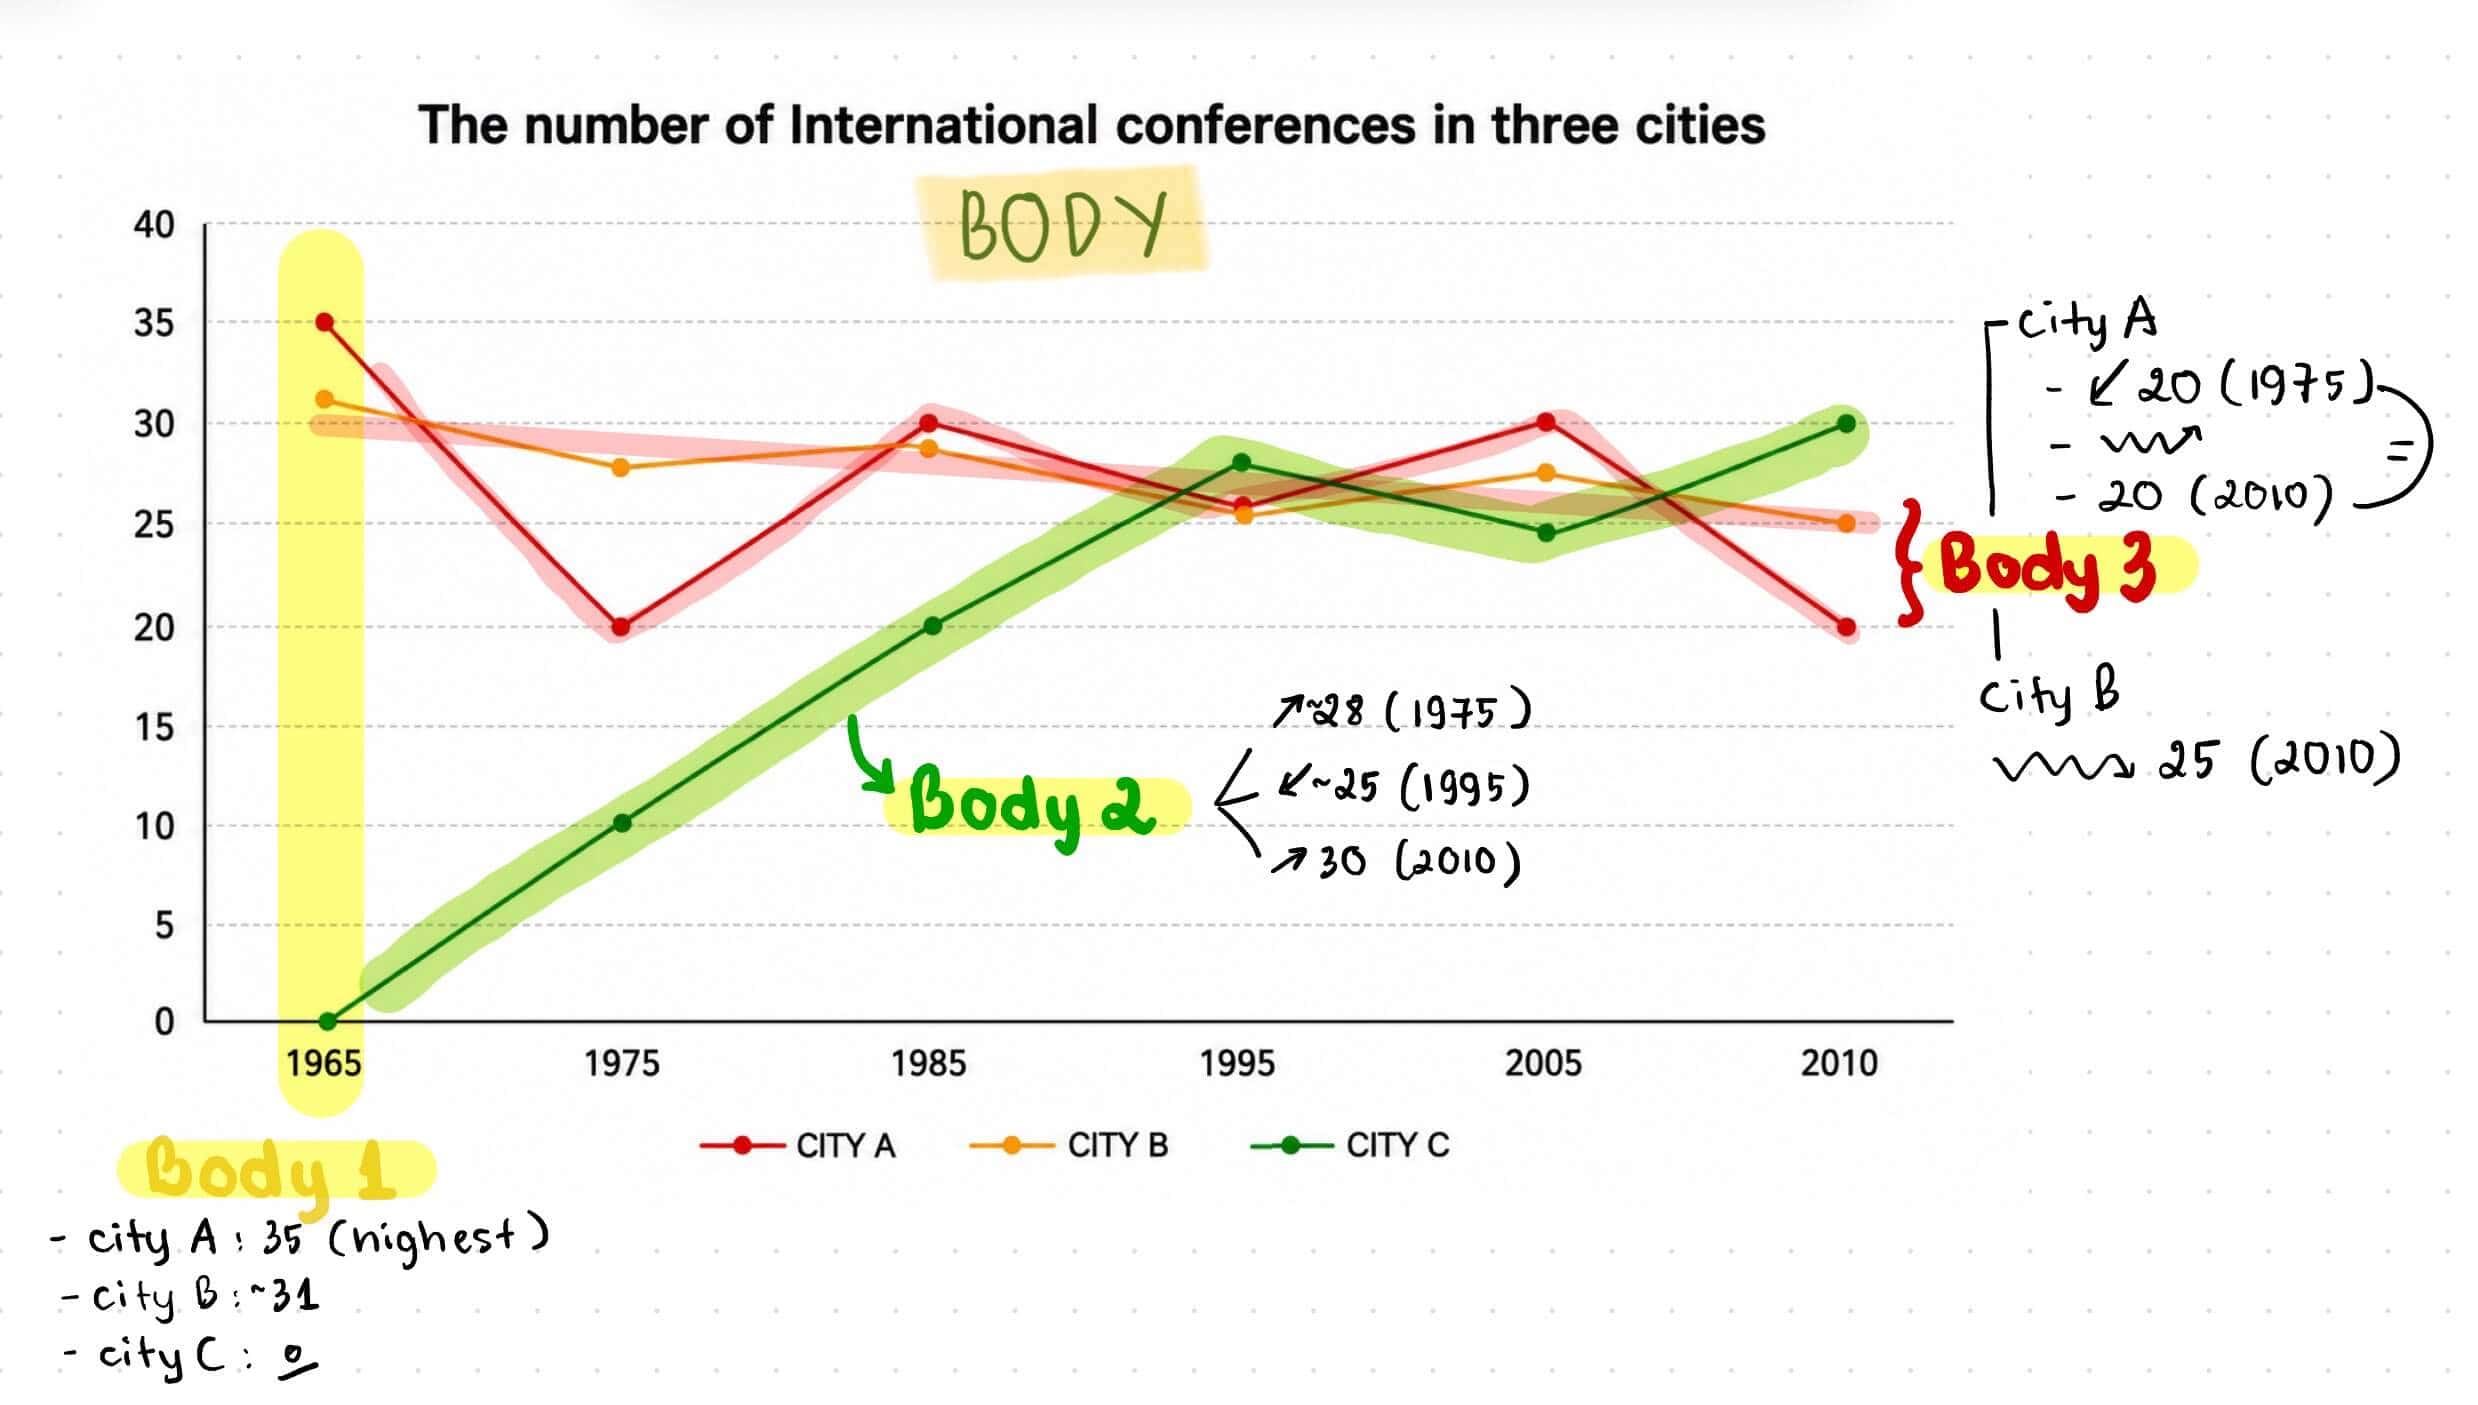
Với bài này Huyền sẽ chia thân bài như sau:
- BODY 1: Năm 1965 -> Nêu số liệu của cả 3 đường trong năm đầu tiên
- BODY 2: Từng đường đã thay đổi như thế nào từ đó cho tới năm cuối.
Vì Body 2 khá dài nên Huyền sẽ tách Body 2 thành 2 phần, vậy tổng cộng ta sẽ có 3 phần Body:
- BODY 1: Năm 1965 -> Nêu số liệu của cả 3 đường trong năm đầu tiên
- BODY 2: City C
- BODY 3: City A & B
Bài mẫu
The line graph compares how many international conferences were held in three different cities between 1965 and 2010.
Overall, cities A and B, despite some fluctuations, experienced overall declines in the number of international conferences over the given period, while city C witnessed a substantial increase, eventually surpassing the other two cities at the end of the period.
In 1965, city A had the highest number of international conferences, at 35, followed by city B, at around 31, and none were held in city C.
Thereafter, however, city C saw a dramatic increase, with conference numbers rising sharply to approximately 28 in 1995. The annual number then dropped slightly to 25 in 2005 before rebounding to end the period at 30 conferences, making it the most popular conference venue of the three.
Cities A and B displayed different trends. The number of international conferences in city A fell to a low of 20 in 1975 before experiencing some ups and downs and eventually returning to this level in 2010. City B also fluctuated in a downward trend, but less dramatically than city A, with conference numbers reaching 25 in the final year.
Cho e hỏi chủ ngữ coa cần phải luôn luôn là the number + increase/rise… ko ạ, theo e thấy thì nếu mình ns city A, B ,C tăng giảm thì k đúng, vì nó k phải số liệu, lm sao tăng giảm đc